Our work

Delivered work, and the capabilities behind it.

A real engagement first, then the systems we deploy for new work — on the same stack, inside your own cloud perimeter. Capabilities are shown on synthetic data; we never show client records.

Delivered engagement
Delivered engagement · Health analytics

Turning siloed DHIS2 data into decisions a whole team can act on.

A pan-African paediatric & adolescent HIV treatment network.
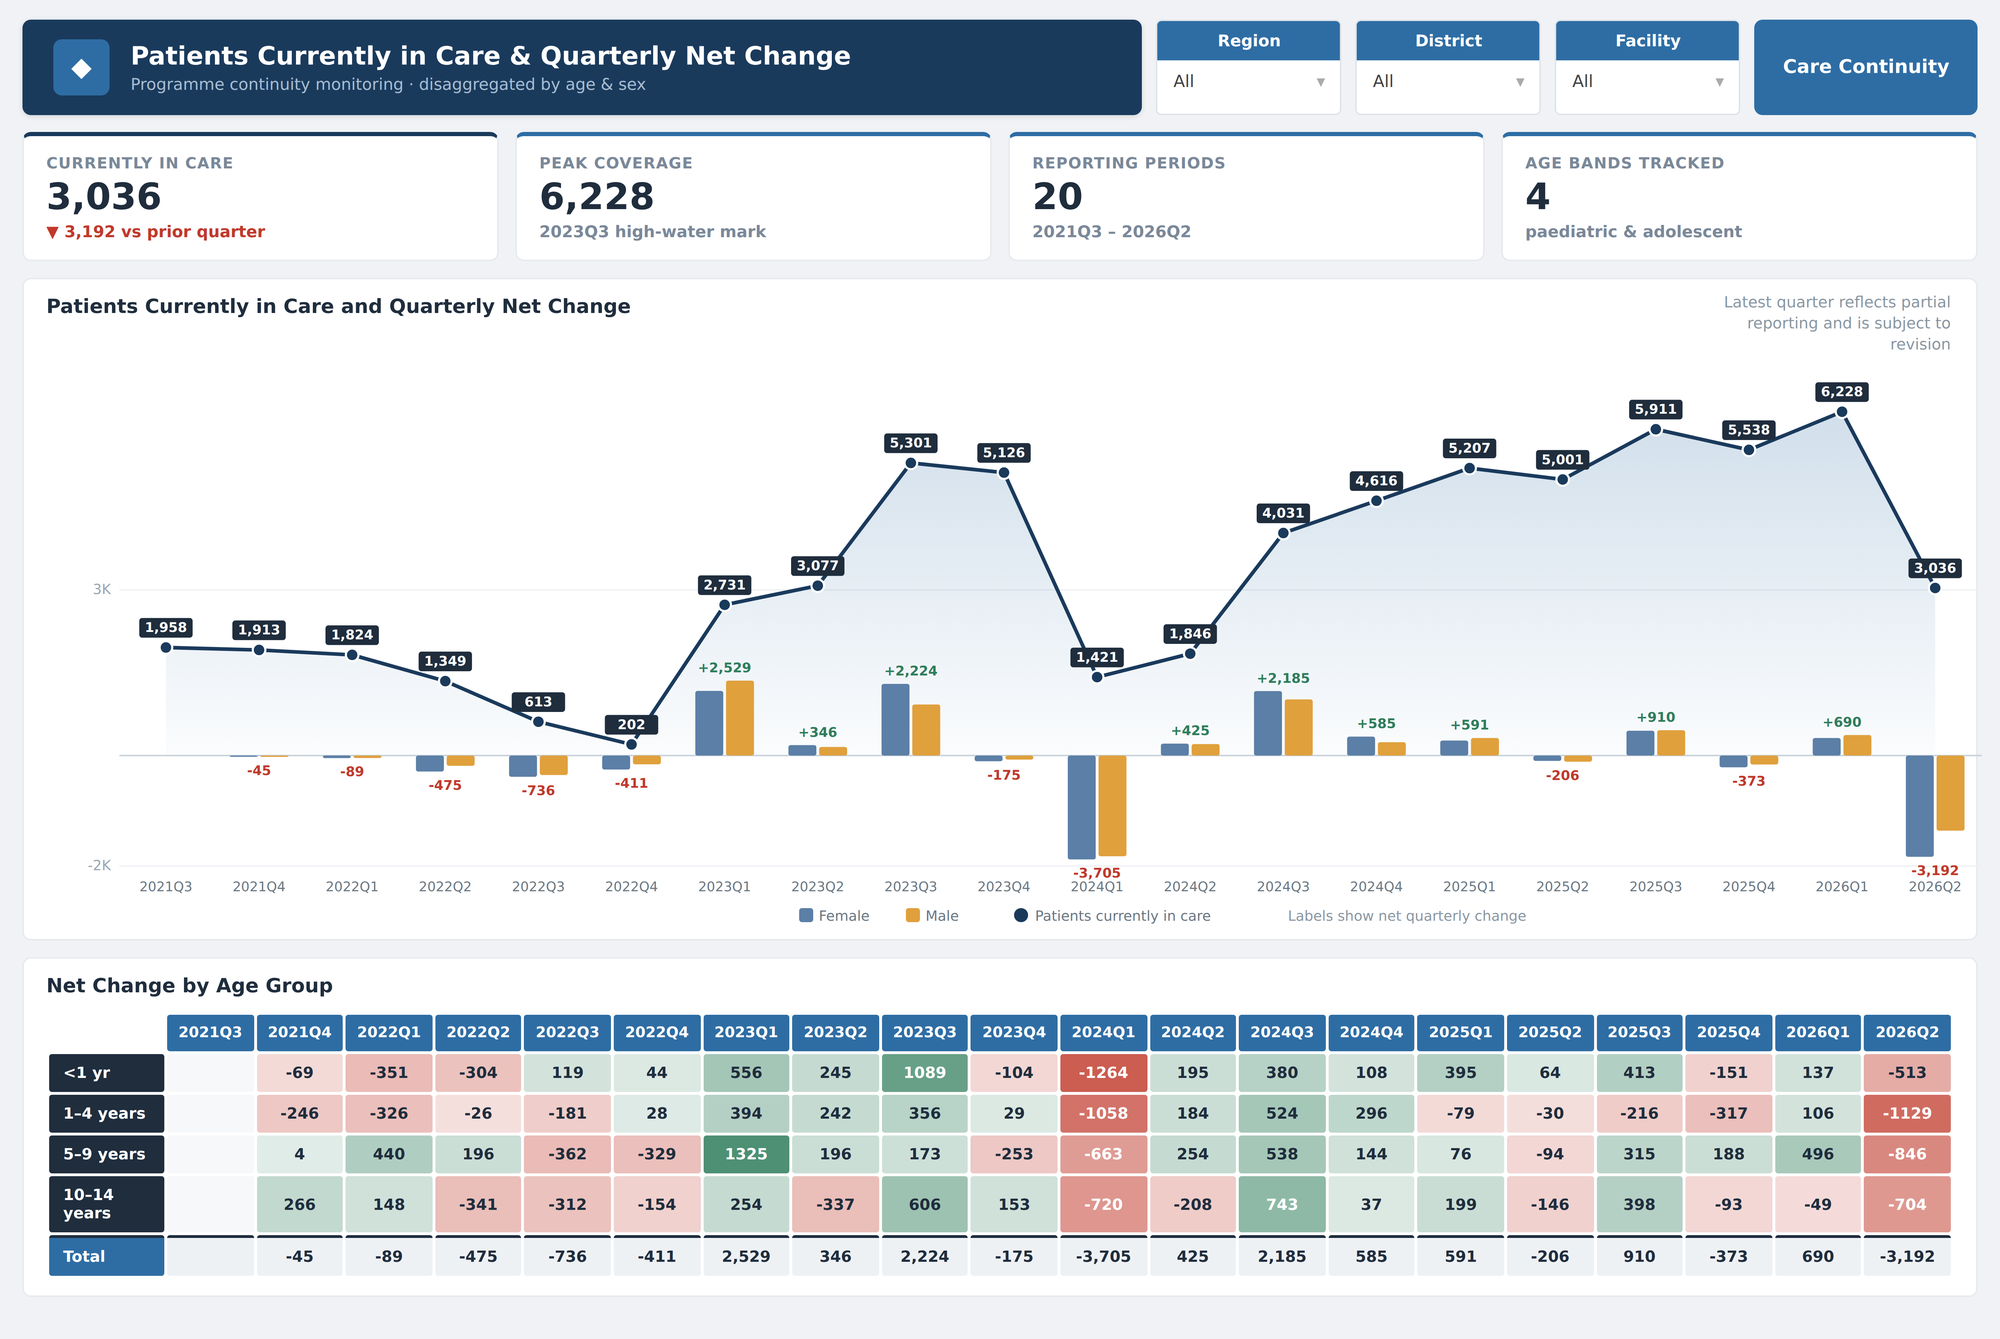
A Power BI dashboard showing patients currently in care and quarterly net change over twenty reporting periods, with KPI cards, a combined cumulative line and net-change bar chart disaggregated by sex, and an age-group matrix with a diverging colour scale.
Representative of the delivered reporting — indicator names and figures are synthetic; no client data is shown.
The challenge

Program and clinical data lived in DHIS2 and tenant systems — disaggregated across national, facility, and site levels, but never consolidated into a view stakeholders could act on. Reporting meant manual assembly, and the site-level patterns that drive intervention decisions stayed buried in the source data.

What we built
  • DHIS2 integration — a direct connection into the health-information system underpinning the program.
  • Multi-fact star schema — national, facility, and site fact tables with conformed dimensions, built to scale as indicators grow.
  • Disaggregation-aware shaping — Power Query transformation parsing age/sex/site breakdowns, with cleaning and validation.
  • A full DAX indicator library — aggregations, rates, ratios, and time-intelligence measures across every indicator.
  • Deployed to their own tenant — access configured, clean handover. The platform is theirs to run.
The result
Data democratized across stakeholders — one shared, trusted view in place of siloed extracts.
Timely decision-making, with indicators available when they're needed rather than weeks later.
Better-informed interventions, guided by site-level visibility the team couldn't previously see.
Built with Power BI DHIS2 Power Query DAX Star-schema modeling
Further engagements
Engagement · Data engineering

Standardizing multi-country health data into one trusted layer.

The context

A multi-country health program held data in fundamentally different shapes across its sites — national aggregate reporting in one system, patient-level records in several different clinical systems, and a long tail of program surveys and ad-hoc extracts. Each country spoke a slightly different dialect of the same indicators. No two sources agreed on names, codes, or structure.

What the work involved
  • A consolidation layer — aggregate and patient-level data from many country systems brought into one governed lakehouse, without forcing identifiable records to travel further than they should.
  • Conformed standardization — a shared vocabulary of indicators, codes, and dimensions mapped across every source, so a metric means the same thing in every country.
  • Automated, orchestrated pipelines — cloud data-integration moving each source on a schedule, with the transformation logic driven by the standard rather than hand-coded per system.
  • Quality and reconciliation — layered validation at ingest and consolidation, so downstream reporting rests on data that has already been checked.
The capability demonstrated

Turning a fragmented, multi-system, multi-country data estate into a single conformed foundation that donor-aligned reporting and analytics can trust — the unglamorous engineering that everything downstream depends on.

Pattern & tools LakehouseCloud data pipelines Conformed dimensionsMetadata-driven ETL Aggregate-at-edge
Engagement · AI data engineering

The pipeline behind a grounded conversational-analytics layer.

The context

Program staff and decision-makers needed to ask questions of complex health data in plain language and get trustworthy answers — narrative summaries, visualizations, and trends — without a wrong number ever slipping through. The hard part was never the chat interface. It was the data engineering underneath that lets a language model answer safely.

What the work involved
  • A governed indicator layer — verified definitions and formulas the model routes to, so measurements are computed by trusted code rather than generated.
  • Intent routing — questions mapped to the right data set and the right agent by intent and context, with grounding guardrails before any response.
  • Aggregate-only exposure — the model reasons over findings, not raw patient records, keeping sensitive data out of the layer that doesn't need it.
  • Traceable output — answers carry provenance back to the source, so a figure can always be checked rather than taken on faith.
The capability demonstrated

The engineering discipline behind trustworthy AI on sensitive data — the same "LLM orchestrates, verified services calculate" pattern we build on. A public example of this approach in pediatric-health data is documented in Microsoft's account of the gl-AI-ser system.

Pattern & tools Supervised RAGGoverned indicators Intent routingGrounding guardrails Provenance
Built systems
Skills-to-Staffing Matching

Match the right people to the right projects.

A web portal that matches staff to projects by structured skill profiles — a rated-skills catalog, profile intake, project staffing, an approvals workflow, and oversight reporting. Replaces manual, spreadsheet-driven allocation.

AzurePostgresRole-based accessApprovals workflow
meridian.skills-portal
Skills & Projects
ME
STAFFING
OVERSIGHT

Workspace overview

Welcome back — Meridian Health Programs
48Active staff
31Complete profiles
7Open projects
142Catalog skills
Maternal Health Survey — Region 43 to staff
Data Quality Audit — NationalStaffed
M&E Framework RedesignApproval
Illustrative example · synthetic data
Issue Tracking & Remediation

Track technical issues from intake to resolution.

A web application managing the full issue lifecycle — intake, triage queue, assignment, remediation activities, and resolution tracking with full audit history. Role-based access and structured tagging by country and program area.

AzureMySQLAudit historyTriage workflow
meridian.issue-tracker
Technical Excellence
ME
REVIEW
ADMIN

Issue #148 — Survey sync failure

Identified Aug 2, 2026 · Region 4 · Data pipeline
In progressStatus
MediumPriority
2Activities
Remediation — reconfigure sync job
Updated Aug 4 · 1 note
Completed
Root-cause review
Assigned · M. Okonkwo
Open
Illustrative example · synthetic data
Embedded Power BI Reporting Portal

Governed dashboards, scoped to who's looking.

A custom portal wrapping embedded Power BI in a governed access layer — internal SSO plus credentialed external-partner sign-in, and row- and report-level entitlements so each user sees only their country, programme, and organization. Report search, full-screen viewing, and a feedback loop to report owners.

Power BI EmbeddedAzureSSO + partner authRow-level security
meridian.analytics-portal
Analytics Portal
BROWSE
MANAGE

Program Coverage — Region 4

Scoped to your country · programme · organization
Coverage by district
Completion rate
Internal SSOstaff@meridian — no separate password
Partner accessMinistries & partners — issued credentials
Illustrative example · synthetic data
RAG & Conversational Intelligence

Ask your data questions in plain language.

Retrieval-augmented systems grounded in an organization's own data — every answer traces back to source rows and carries a calibrated confidence label, with no hallucinated claims. The reasoning layer behind our program intelligence briefs and conversational reporting.

RAG architectureAnthropic ClaudeSource-groundedConfidence-labelled
meridian.intelligence-engine
Why is Region 4 retention dropping?
67% of the drop is concentrated in participants aged 18–24 who entered the program in Q3. The two lowest-retention districts share a common outreach gap. ● Confidence · Established
Source · retention_by_site.parquet · 1,204 records
What would closing that gap recover?
Lifting week-3 check-in compliance from 41% to 70% projects a ~5.2-point retention recovery across the cohort. ● Confidence · Suggestive
Ask a follow-up question…
Send
Illustrative example · synthetic data
Advisory & strategy
Strategy, Advisory & Funding

The thinking that precedes the building.

Where most consultancies sell either strategy decks or pure delivery, we do the advisory work that makes the build worth doing — and can write the funding case that pays for it. Senior-led, grounded in what we actually ship.

Data & AI strategy M&E frameworks Architecture review
01
Data & AI roadmapsUse-case prioritization, architecture decisions, fractional technical leadership.
02
Grant & proposal strategyTechnical writing for foundation grants and RFPs — the impact story and the credible spec.
03
M&E framework designIndicator architecture and logic models that reporting can actually run on.
04
Funder positioningTurning existing work into its strongest form for cloud-partnership and grant programs.
Not sure which engagement fits?

Book thirty minutes. You will leave with a clearer view of your options and an honest recommendation on the right next step.

Book a 30-minute call →