Power BI’s time-intelligence functions — TOTALYTD, SAMEPERIODLASTYEAR,
DATEADD, PREVIOUSQUARTER — are genuinely useful, and they all share one
requirement that program data routinely violates: they need a real date column,
in a table marked as a date table, with contiguous dates. What you actually get
from DHIS2, aggregate reporting tools, and most donor systems is a text period:
2026Q2, 2026Q2, Jan-26, FY26 Q3. A string that looks like a period but
carries none of the ordering or arithmetic a date has.
Point PREVIOUSQUARTER at that and it returns blank, or worse, something
plausible-but-wrong. The fix isn’t to fight the functions — it’s to stop needing
them for the one comparison you make most: this period versus the one before it.
The problem: “the previous quarter” isn’t obvious to a string
Ask a human for the quarter before 2026Q2 and they say 2026Q1 instantly. Ask
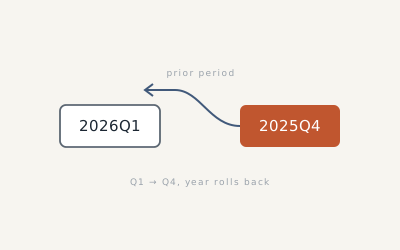
them for the one before 2026Q1 and they say 2025Q4 — the year rolls back and
the quarter wraps to 4. That wrap is the whole difficulty. A naive “subtract one”
breaks at every year boundary, and string sorting alone won’t save you because
2025Q4 sorts after 2025Q1 correctly but the arithmetic of the wrap still has
to happen somewhere.
So you compute the prior period explicitly: parse the year and quarter out of the
string, handle the Q1→Q4 rollover, reassemble the prior period as a string, and
look up the measure at that period. Here’s the pattern, written against a period
table whose key is a QuarterID like 2026Q2:
Clients currently in care – Previous Quarter =
VAR CurrentPeriod =
    SELECTEDVALUE('period'[QuarterID])

VAR CurrentYr =
    VALUE( LEFT( CurrentPeriod, 4 ) )

VAR CurrentQtr =
    VALUE( RIGHT( CurrentPeriod, 1 ) )

VAR PriorYr =
    IF( CurrentQtr = 1, CurrentYr - 1, CurrentYr )

VAR PriorQtr =
    IF( CurrentQtr = 1, 4, CurrentQtr - 1 )

VAR PriorPeriod =
    FORMAT( PriorYr, "0000" ) & "Q" & FORMAT( PriorQtr, "0" )

RETURN
    IF(
        ISBLANK( CurrentPeriod ),
        BLANK(),
        CALCULATE(
            [Clients currently in care],
            REMOVEFILTERS( 'period' ),
            'period'[QuarterID] = PriorPeriod
        )
    )
Why each piece is there
SELECTEDVALUE guards the grain. Prior-period logic only makes sense when a
single period is in context — one column of a matrix, one point on a line.
SELECTEDVALUE returns the period when exactly one is selected and blank
otherwise, which is exactly when you want the measure to stand down rather than
compute nonsense across a range.
LEFT / RIGHT / VALUE parse the string into numbers. LEFT(…,4) takes the
year, RIGHT(…,1) the quarter, and VALUE turns those substrings into integers
you can do arithmetic on. This is the step that replaces the date column you don’t
have — you’re extracting ordering from the text yourself.
The two IFs handle the wrap. If the current quarter is 1, the prior quarter
is 4 of the previous year; otherwise it’s the same year, one quarter back. Two
lines, and every year-boundary bug disappears.
FORMAT reassembles the key in the exact shape of your period column. The
"0000" and "0" format strings matter — they rebuild 2026Q1 with the same
zero-padding and structure as the real QuarterID, so the lookup matches. If your
periods look like 2026-Q1 or Q1 2026, this is the one line you adjust.
REMOVEFILTERS('period') then re-filters to the prior period. This is the
quiet heart of it. The current filter context is pinned to 2026Q2; you strip
that, then set the context to the computed prior period, and evaluate the base
measure there. Without the REMOVEFILTERS, you’d be intersecting “this quarter”
with “last quarter” and getting nothing.
What it unlocks
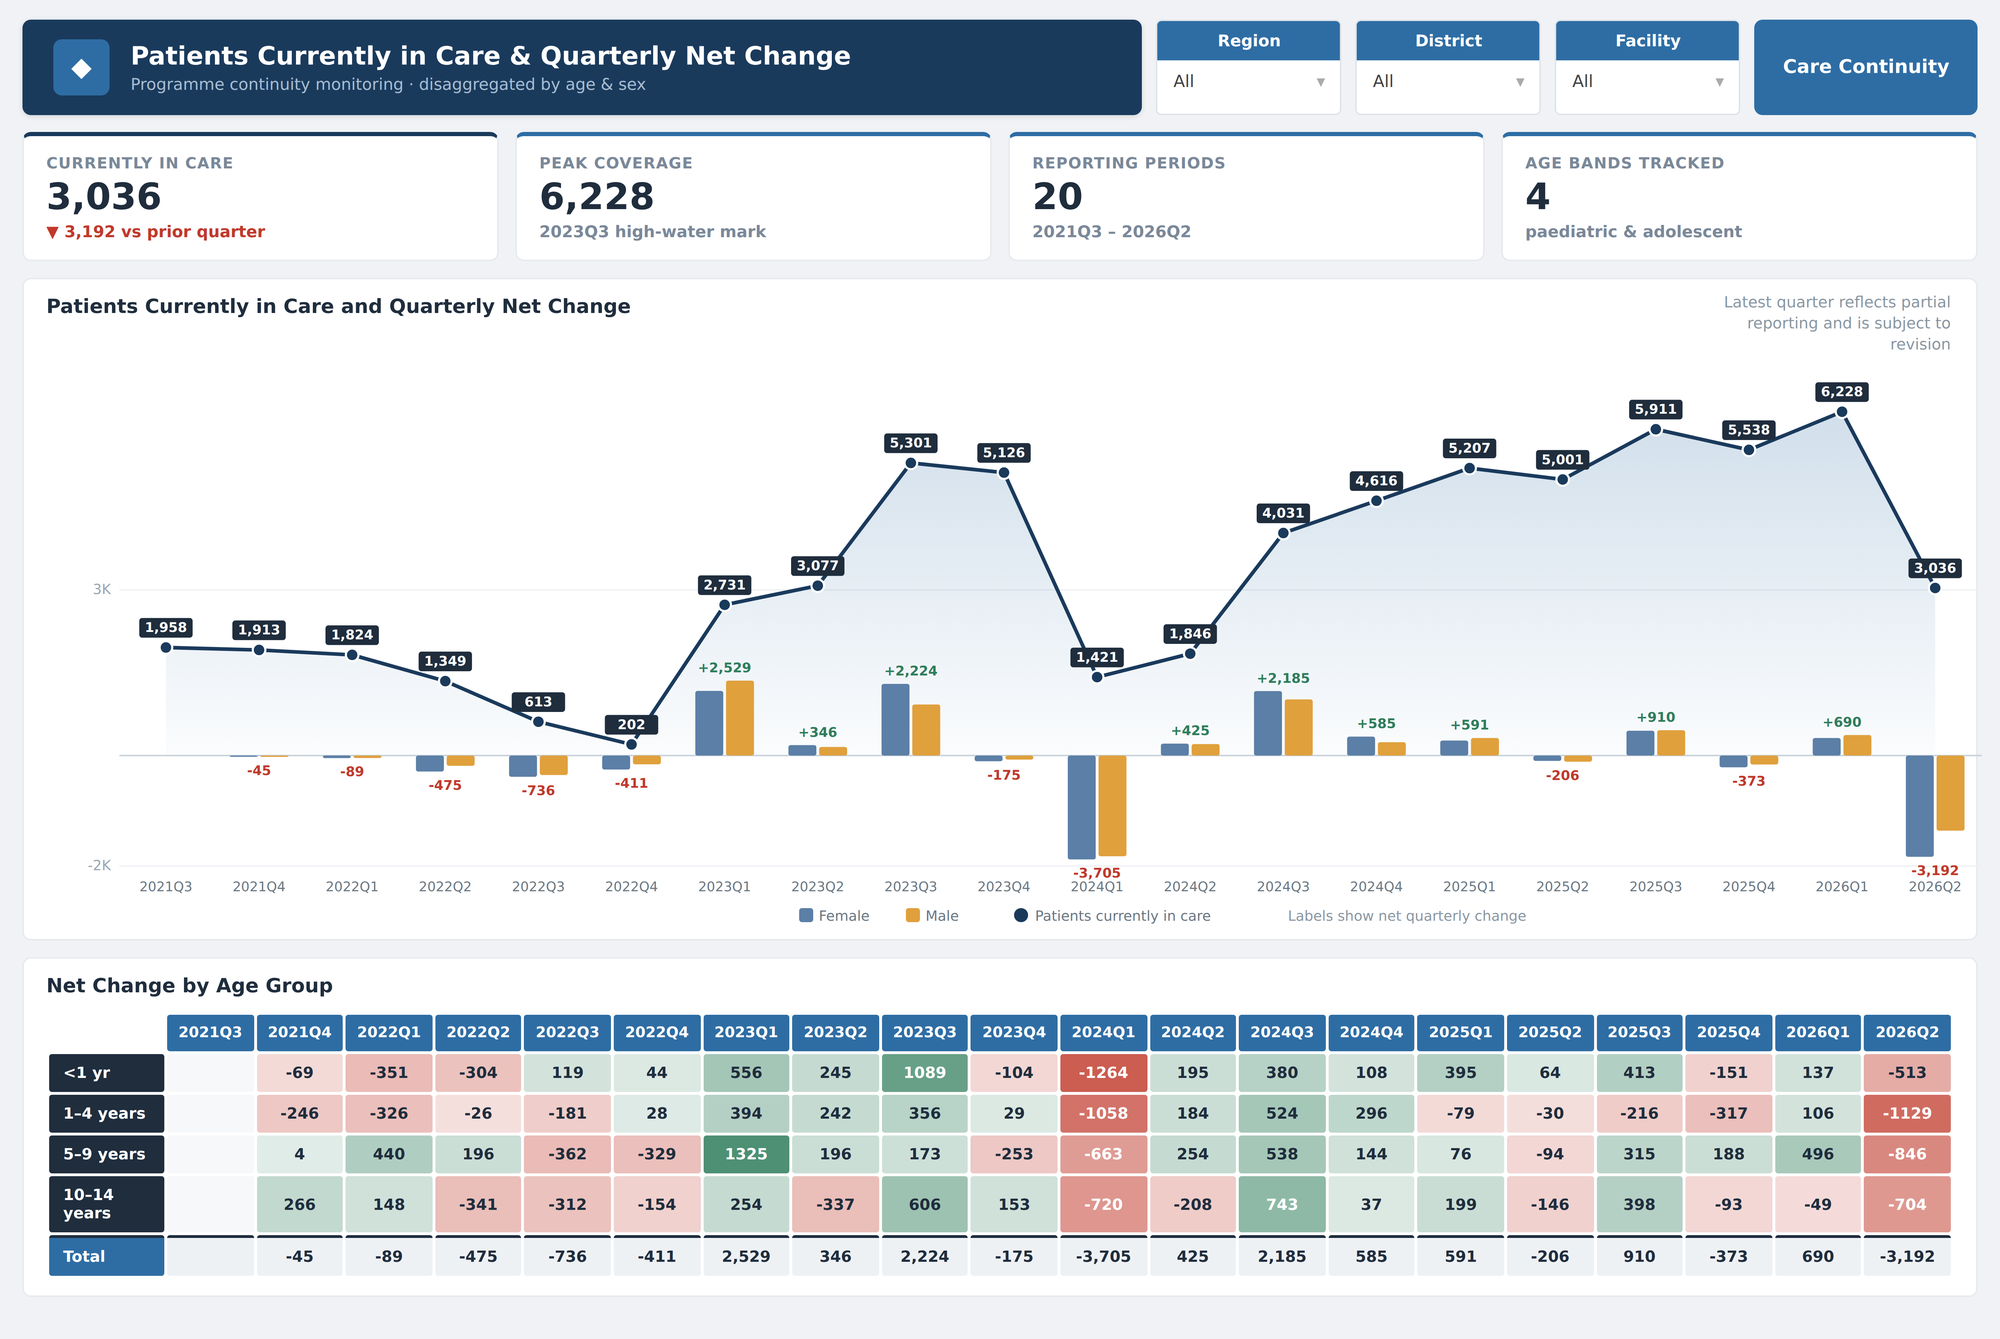
Once you have a reliable prior-period measure, the things stakeholders actually ask for become one subtraction away: net change quarter-over-quarter, percentage change, directional indicators for a matrix. The quarterly net-change view below — a cumulative “currently in care” line over per-quarter net change, disaggregated by age and sex — is built entirely on this pattern. Every net-change figure is current-period minus prior-period, computed with the logic above, and it holds up across every year boundary in the series.
The honest caveat
This pattern is deliberately narrow: it solves prior single period, not the full sweep of time intelligence. If you need rolling twelve-month windows, year-to-date across fiscal calendars, or same-period-last-year at scale, the right move is still to build a proper date table and map your text periods onto it once — then the native functions work as designed. But for the single most common ask in program reporting — “how does this quarter compare to last quarter?” — computing the prior period from the string is direct, transparent, and unbreakable at the year boundary. Sometimes the smaller tool is the right one.
This is a field note from our practice. For the modelling groundwork that makes measures like this clean to write, see Modeling disaggregated DHIS2 data in Power BI.